Optimize core queries at scale
As the amount of content on a site increases, some core WordPress queries can take a longer amount of time to execute. In some cases, this can impact site performance and resiliency.
Category queries and recent posts widgets
One example, that is a very common performance issue as sites grow, is the standard category (or archive) query. A very similar variation can be seen in on-page widgets, particularly on news sites, that display the most recent 5 or 10 posts overall, or in a category.
The widget code may look something like this:
// Display the most recent news posts
function my_recent_news_widget() {
	$args = array(
		'category_name' => 'news',
		'posts_per_page' => 5,
		'post_status' => 'publish',
		'ignore_sticky_posts' => true,
		'no_found_rows' => true,
	);
	$recent_posts = new WP_Query( $args );

	echo '<div class="most-recent-news"><h1>News</h1>';
	while ( $recent_posts->have_posts() ) {
		$recent_posts->the_post();
		the_title( '<h2><a href="' . get_permalink() . '">', '</a></h2>');
	}
	echo '</div>';
	wp_reset_postdata();
}A built-in category query is very similar. WordPress automatically creates these queries when it sees a URL designating a category, such as /category/news/.
When the WP_Query class converts these to SQL, that will look something like the following, where 3 is the news category ID:
SELECT wp_posts.ID FROM wp_posts
LEFT JOIN wp_term_relationships ON (wp_posts.ID = wp_term_relationships.object_id)
WHERE 1=1 AND
wp_term_relationships.term_taxonomy_id IN (3) AND
wp_posts.post_type = 'post' AND
wp_posts.post_status = 'publish'
GROUP BY wp_posts.ID
ORDER BY wp_posts.post_date DESC
LIMIT 0, 5The above statement is retrieving the most recent 5 post IDs in the category. Though the objective of the statement may appear simple, its performance may actually be very slow.
The overall size of the posts table that are queried—in particular the number of posts in that category—can lead to slow performance; not the number of posts returned.
Understanding the underlying query behavior
If a site has a million posts covering a 10 year period, and perhaps half of them are in the news category, then the above query, each time it runs, will need to obtain all the news posts via the JOIN, which are published posts, and then sort that by date, in order to get the most recent 5.
The sort is where the slowness happens. For that many posts, typically the database will need to use a filesort, or copy the list of posts to a temporary table in a physical file on disk and then run a sort on the file. This is because the size of the table prohibits doing this action in memory. And that can be very slow, and also can slow down other database operations that need to use a filesort.
If your site is frequently running these queries to build the list of posts for categories, the database is doing more work than necessary. It’s using more resources than needed, and other queries will need to wait for it to complete the expensive sort.
MySQL’s EXPLAIN command demonstrates this:

The example above shows that 677,527 rows must be sorted to find the recent 5.
While there is an index called type_status_date on the posts table, for type + status + date, the index is not going to be used to narrow down the recent posts. MySQL’s optimizer is just grabbing all the (600k+) posts in news (because there is an index in wp_term_relationships for term_taxonomy_id) and then sifting them (by type and status) and sorting by date. But that can be easily improved.
Improving the query
Because the index includes a date, and it’s rather unlikely that the last 5 news posts are going to be more than a week old, adding a date constraint will usually help MySQL decide to use the post index type_status_date first.
Jumping to the modified SQL, we have:
SELECT wp_posts.ID FROM wp_posts
LEFT JOIN wp_term_relationships ON (wp_posts.ID = wp_term_relationships.object_id)
WHERE 1=1 AND
wp_term_relationships.term_taxonomy_id IN (3) AND
wp_posts.post_type = 'post' AND
wp_posts.post_status = 'publish' AND
wp_posts.post_date > '2021-03-03 00:00:00'
GROUP BY wp_posts.ID
ORDER BY wp_posts.post_date DESC
LIMIT 0, 5We’ve just added AND wp_posts.post_date > '2021-03-03 00:00:00' (where the date is about a week in the past).
Now the EXPLAIN for this:

Note that the order of operations has shifted – first the posts table uses the type_status_date index to get the range of posts that match the post type, the publish status, and has a date after March 3 at midnight. That is just 5825 rows. Then the term_taxonomy_id index is used to match the news posts and the newest 5 are chosen.
There can be a significant difference in execution time for these two queries. Depending on how busy the database is, the original query can sometimes take more than a minute. That can lead to site-wide performance degradation. The new query, even if it uses a temporary table, requires much less disk space and time to sort a much smaller number of items.
Updating the PHP code
It’s fairly easy to modify our code to get it to use the more optimized SQL. We just need to add that date constraint in code.
For the widget, we can add it directly. Line 4 and 11-17 cover this.
// Display the most recent news posts
function my_recent_news_widget() {
	// constrain to just posts in the past week
	$recent = strtotime( 'last week' );
	$args = array(
		'category_name' => 'news',
		'posts_per_page' => 5,
		'post_status' => 'publish',
		'ignore_sticky_posts' => true,
		'no_found_rows' => true,
		'date_query' => [
			'after' => [
				'year' => date( 'Y', $recent ),
				'month' => date( 'n', $recent ),
				'day' => date( 'j', $recent ),
			]
		],
	);
	$recent_posts = new WP_Query( $args );

	echo '<div class="most-recent-news"><h1>News</h1>';
	while ( $recent_posts->have_posts() ) {
		$recent_posts->the_post();
		the_title( '<h2><a href="' . get_permalink() . '">', '</a></h2>');
	}
	echo '</div>';
	wp_reset_postdata();
}For a main category query that can be modified via pre_get_posts, a targeted modification can be defined. This does not include pagination. For pagination to occur, a longer dater range or conditional code may be necessary.
function my_category_date_constraint( $query ) {
	if ( is_admin() || ! $query->is_main_query() ) {
		return;
	}
	if ( $query->is_category() ) {
	    $recent = strtotime( 'last week' );
		$date_filter = [
			'after' => [
				'year' => date( 'Y', $recent ),
				'month' => date( 'n', $recent ),
				'day' => date( 'j', $recent ),
			]
		];
		$query->set( 'date_query', $date_filter );
	}
}
add_action( 'pre_get_posts', 'my_category_date_constraint' );With these changes, the site performance should be greatly improved.
The example code above is rounding up to midnight, i.e. 2021-03-03 00:00:00 because of the query cache, which will use a hash of $args as a cache key. If that contained a time of day, it would be effectively missing cache almost all of the time. Even with a faster query, the object cache of the query results is critical to resilience.
Opportunities for optimization are always present
This example illustrated one of the most frequently seen and highest impact query patterns; similar patterns (involving large table sorts) may be present in other custom code or in code that handles RSS feeds and sitemaps. When queries are flagged as slow, they should not be dismissed as infrequent, or edge cases; any amount of optimization improves site resilience and reduces database load.
Identifying issues in New Relic
As noted earlier, it’s not always easy to know that these queries have become inefficient. The change can happen over time, or only become noticeable when traffic increases and multiple slow queries affect the site’s overall performance.
But by reviewing New Relic traces and database performance, these can be spotted, and with the information above, resolved.
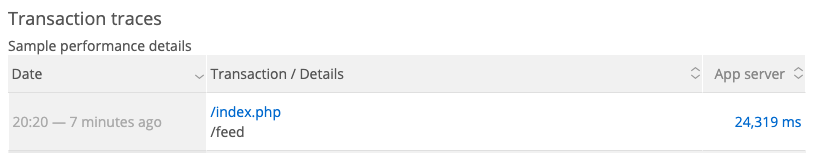
New Relic slow transaction traces are a good indication of this type of performance issue. Transaction traces can be located in the Transactions section of New Relic at the bottom right.
After opening the actual trace, the Database queries tab can be selected.
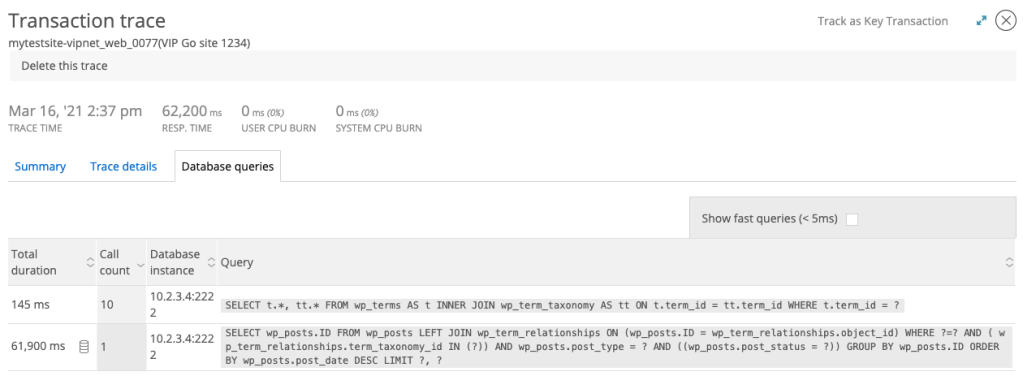
The slow query is obfuscated, but has a tell-tale pattern matching the query discussed above.
Selecting the DB icon will reveal the EXPLAIN (or query analysis) captured by New Relic as well:
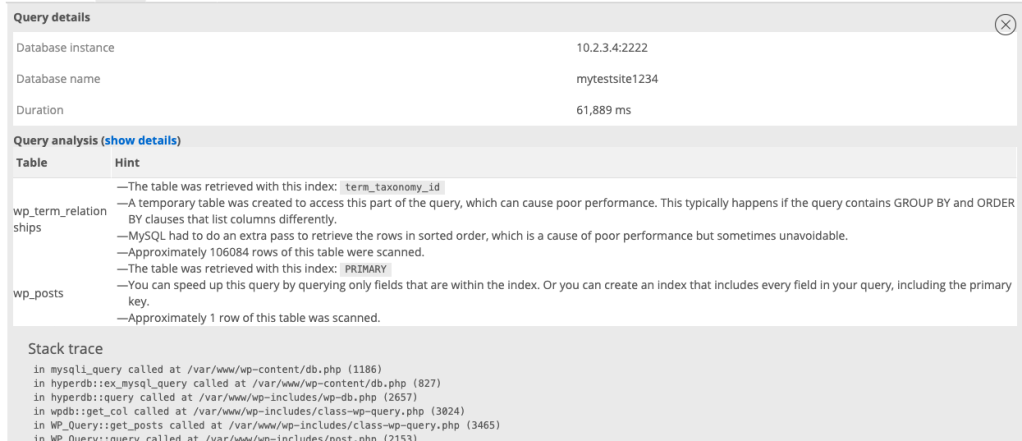
The stack trace should lead to the PHP code that needs to be optimized.
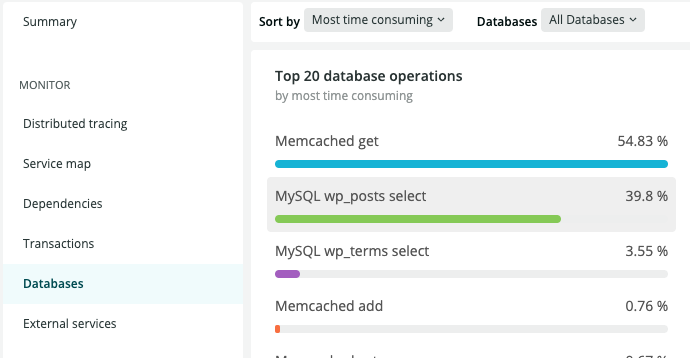
New Relic also shows slow queries in the Databases area under Monitor – typically in the report for wp_posts select.
These queries may also show up in Query Monitor, but will usually be easier to find in New Relic.
It is recommended to periodically review slower queries, and adding date constraints, to maintain good site resiliency.
Last updated: December 22, 2023