Usage
The Usage panel provides access to a record of either chargeable requests (Usage – Requests) or monthly unique visitors (Usage – Visitors Stats) for an organization’s applications. The type of data that is displayed is based on the metric defined in the organization’s contract with WordPress VIP.
Users can interact with available settings to modify the time frame and format of data that is displayed in the Visitor Stats or Chargeable Requests section of the Usage panel.
Access
Prerequisite
To access the Usage panel, a user must have at minimum an Org member role.
To access the Usage panel in the VIP Dashboard:
- Navigate to the organization view of the VIP Dashboard.
- Select “Usage” from the lefthand navigation menu.
Share filtered states of Usage metrics
Filtered states of Usage data create unique URLs that can be copied from the browser address bar and shared with other users in the organization who have an Org member role or Org admin role.
Usage – Visitor Stats
For organizations that have a contract with WordPress VIP based on a Monthly Unique Visitors (MUV) Usage metric, the Usage panel is titled “Usage – Visitor Stats“.
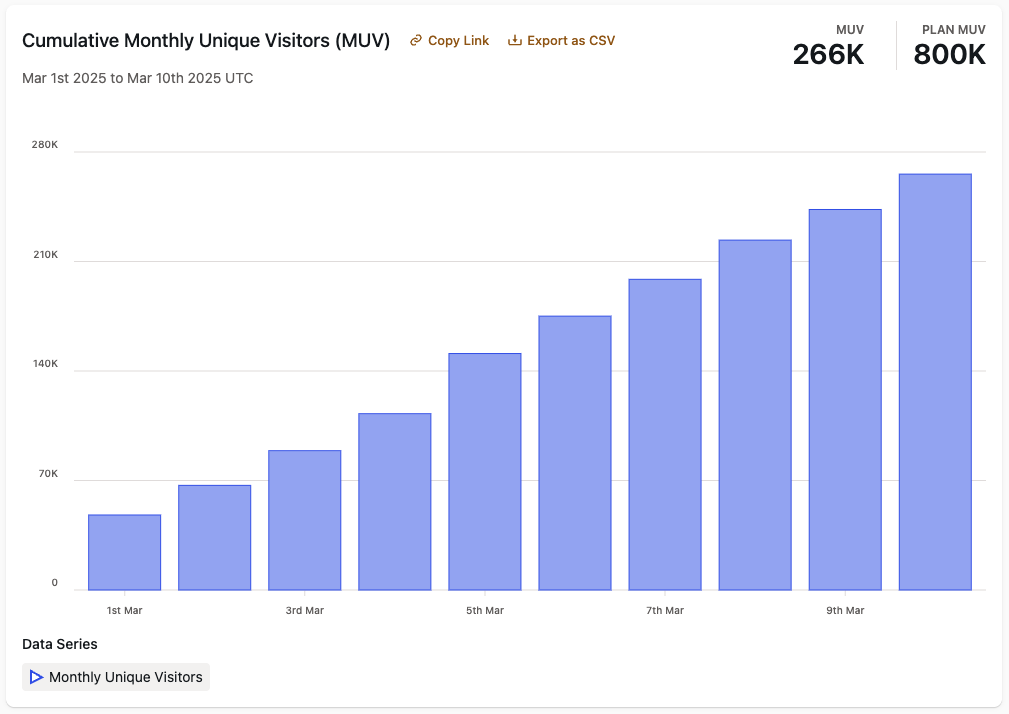
The “Monthly Unique Visitors (MUV)” data for an organization can be accessed by selecting the tab labeled “Visitor Stats” near the top of the Usage panel. MUV data is a cumulative record of monthly unique visitors (MUVs) to an organization’s site(s) tracked by Parse.ly. By default, the data is displayed in a monthly chart format and is a combination of MUV data for all of an organization’s sites across all of its applications.
Reference values are displayed in the upper left of the “Monthly Unique Visitors (MUV)” section:
- MUVS: The total number of MUVs tracked within the monthly range of time that is currently displayed.
- PLAN MUVS: The quantity of MUVs included in an organization’s contractual plan with WPVIP.
Monthly Unique Visitors by Site
The section titled “Monthly Unique Visitors by Site” on the lower area of the Usage panel provides MUV data for an organization’s individual sites in table format.
Sites are listed alphabetically by their Parse.ly Site ID. Information related to each site is displayed across 3 columns:
- Parse.ly Site ID: The value of a site’s Parse.ly Site ID.
- MUV: The number of MUVs tracked within the month that is currently displayed only for this Parse.ly Site ID.
- % of (X) MUV: The percentage of MUVs for an individual site compared to the organization’s monthly total.
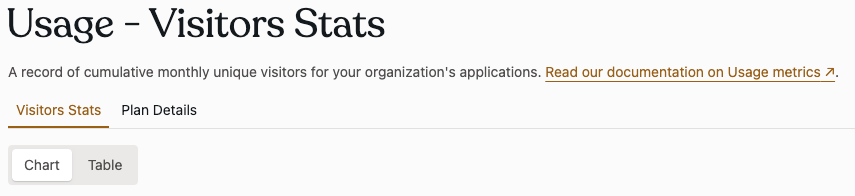
Display data as a chart or a table
All data in the Usage – Visitor Stats panel can be displayed in either a chart format (default) or a table format. The display options for “Chart” or “Table” can be selected using the “Chart / Table” toggle under the Visitors Stats tab.
Filter data by day
Usage data is displayed per day by default when data is displayed in table format. When data is displayed in chart format, Usage data can be reviewed per day by hovering over the displayed timeline graph.
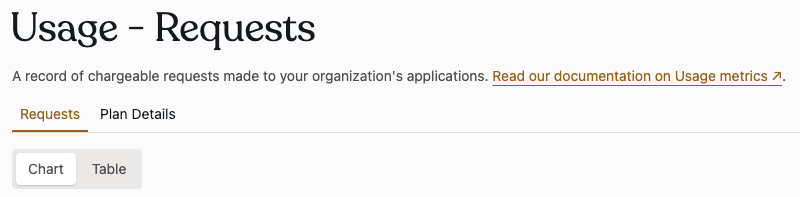
Usage – Requests
For organizations that have a contract with WordPress VIP based on an organization’s platform utilization with HTTP requests, the Usage panel is titled “Usage – Requests“. An HTTP Request, also known as a web request, can be for HTML web pages, static resources such as images, JSON data sent by APIs, and more.
The Usage – Requests panel is a record of chargeable requests made to an organization‘s applications and provides access to historical chargeable request data for analysis no older than 5 December 2020.
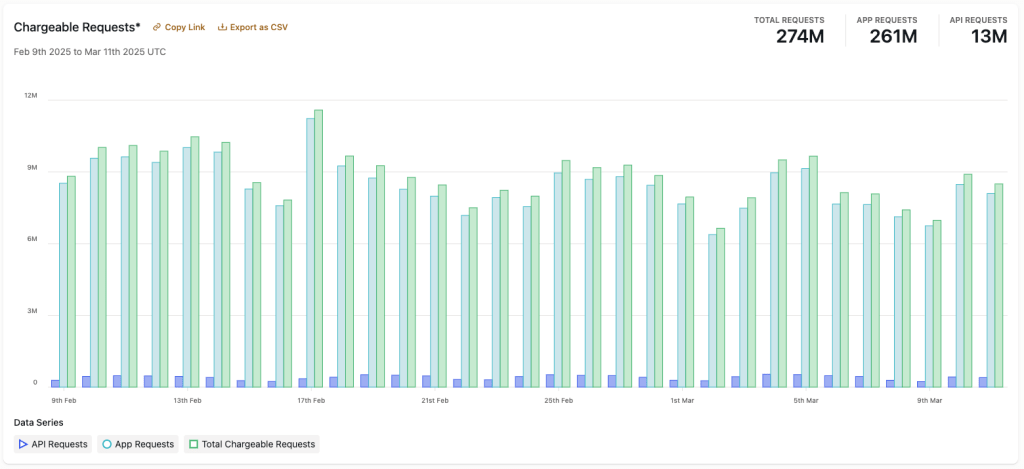
To access “Chargeable requests”, select the tab labeled “Requests” near the top of the Usage panel. By default, the “Chargeable Requests” data is displayed in chart format. The data represents the sum total of all chargeable requests to all applications belonging to an organization made within the currently selected period of time.
- Chargeable requests (Application Requests and API Requests) are displayed by request category (“APP” and “API”) as well as a summary of both (“TOTAL”).
- “Allowance Avg.” represents the monthly allowed requests for an organization’s account divided by the number of days in the filtered date range.
Requests by category
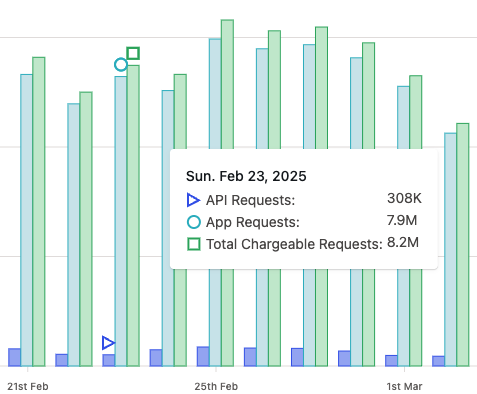
“Chargeable Requests” graph in the
Usage – Requests panel reveals the quantity
of each request type for that date.
Chargeable requests made to an application are separated by category. When request data is displayed in chart form, hover over the bars in the chart to review the quantity of each request type for that date.
Application (APP) Requests
- Count towards platform usage.
- Definition: Requests where the response has a content type of HTML or XHTML
- Examples: web page views, redirects,
404 Not Found, editorial activity
API Requests
- Count towards platform usage.
- Definition: Requests where the response has a content type of JSON
- Examples: REST API, GraphQL API
Total Chargeable Requests
The sum of APP and API requests that count towards platform usage.
Static and Internal Requests
Requests for static assets like CSS, Images, and Javascript as well as Requests from within Automattic and VIP infrastructure do not count towards platform usage. Because of this, static and internal requests are not represented in the Usage – Requests panel.
Display Chargeable Requests by application
By default, Usage data is displayed for all of an organization’s applications combined. To access Usage data for an individual application:
- Select the drop down labeled “Application:“
- Select an application by typing an application’s name in the available search field and selecting an application from the displayed list.
Display data as a chart or a table
All data in the Usage – Requests panel can be displayed in either a chart format (default) or a table format. The display options for “Chart” or “Table” can be selected using the “Chart / Table” toggle under the Requests tab.
Datepicker time selection
A user can select a preset list of time periods or enter custom time periods for Usage data in a datepicker. To access the datepicker, select the field in the upper right of the panel that displays timestamps for the date range of the currently displayed data.
For example, a user can select from a dropdown list of preset windows of time for the “Last 30 minutes” (default), or up to the “Last 12 months” for a production environment.
To select more specific date ranges, select the dropdown option labeled “Custom Range“. In the datepicker interface titled “Custom Date Range“, enter the desired beginning and ending dates in the fields labeled “Start” and “End“. The range of data displayed can be further specified by also entering times (in UTC) for the dates. To save the settings and refresh the displayed data, select the button labeled “Apply” .
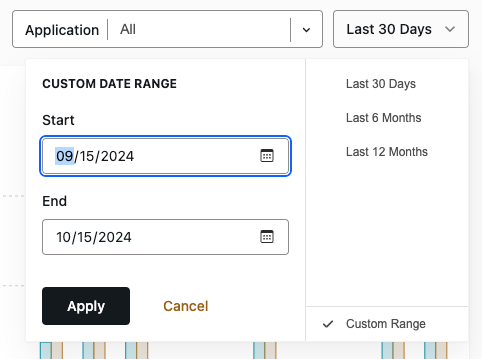
in the Usage – Requests panel with the “Custom Date Range” interface open.
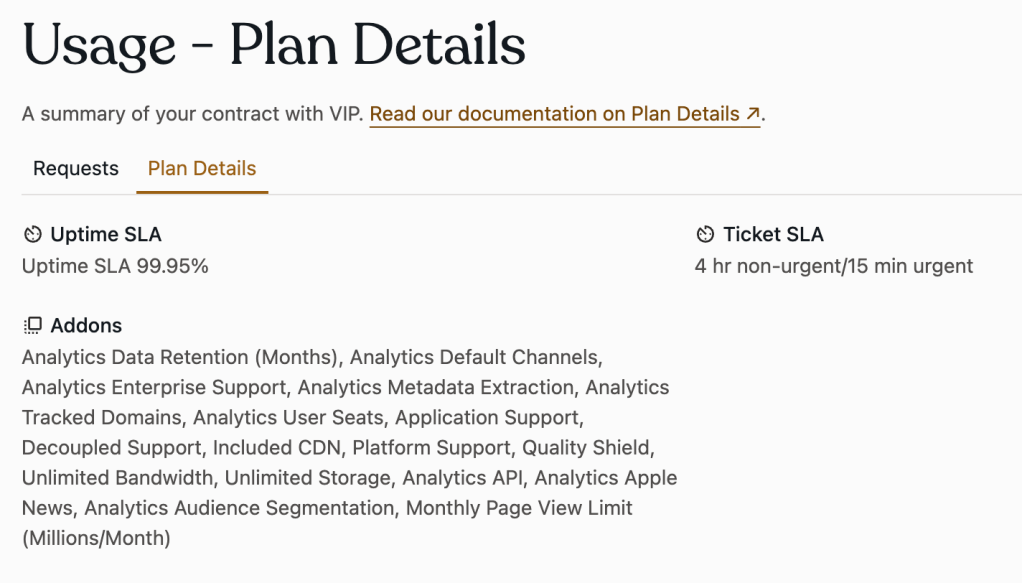
Usage – Plan Details
Prerequisites
Only users with an Org admin role can access the Usage – Plan Details panel.
To access an organization’s plan details, select the “Plan Details” tab near the top of the Usage panel. Plan details are a summary of a customer’s contract with WPVIP including “Uptime SLA”, “Ticket SLA”, and any included “Add-Ons”.
Last updated: June 12, 2026