HTTP metrics
Insights into the performance of responses to HTTP requests that are made to an environment can be reviewed in the Insights & Metrics panel, located in the application view of the VIP Dashboard.
Select the tab labeled “HTTP” to access data that provides insights into the response times for requests, and the types and amounts of HTTP response status codes that are returned by the origin servers and edge cache servers.
- HTTP
2xxresponses (e.g.,200,201,202,203,204) indicate that the request succeeded. - HTTP
3xxresponses (e.g.,300,301,302,303,304) indicate that the request was redirected. - HTTP
4xxresponses (e.g.,400,401,402,403,404) indicate an error on the client side. Most of the time, they do not indicate critical issues affecting a site. For example, if a user requests a page that does not exist, they will see a404 Not Founderror. Users who request access to an application behind IP restriction will see a403 Forbiddenstatus if their IP address is not allowed. In some cases, a pattern of404responses may indicate a missing URL that needs to be redirected. - HTTP
5xxresponses (e.g.,500,501,502,503,504) indicate an error on the server side. For example, a500response could result if an application’s server encounters a PHP fatal error and can no longer respond.
Possible causes for an increase in 5xx status responses from an application:
- An unexpected strain on the servers, caused by recently deployed code.
- A sudden, substantial increase in site traffic.
- A large number of site requests that are bypassing the page cache. Uncached SQL queries can overload the primary database, resulting in
503responses being returned. - Uncached WordPress functions.
- Plugins that generate inefficient SQL queries or trigger SQL-intensive cron tasks that are not designed for a site that is running at enterprise scale.
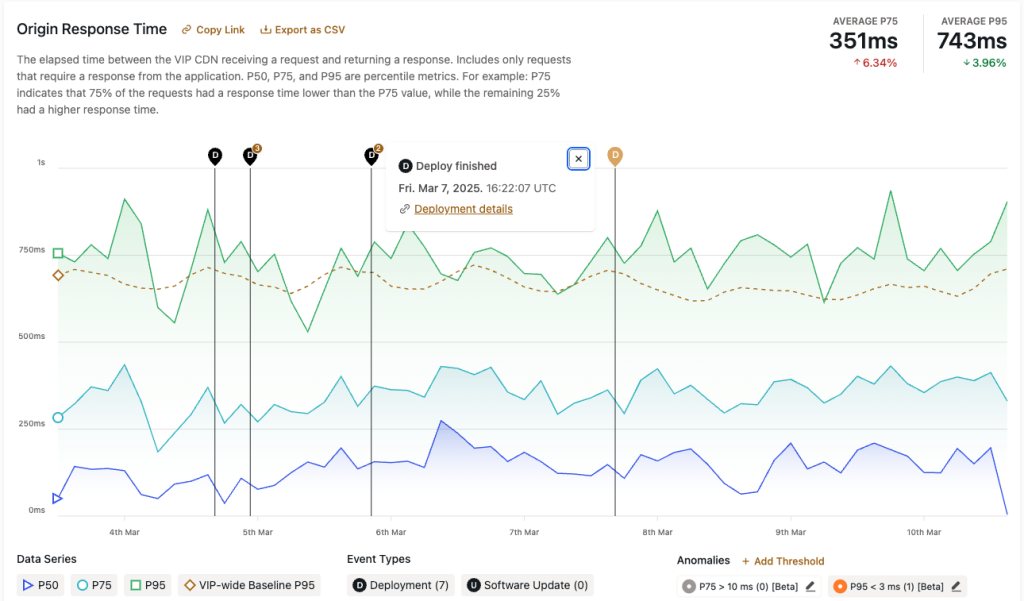
Origin Response Time
The data in “Origin Response Time” indicates the duration of time it takes for the origin server to generate a response and send it back to the page cache. The data also includes the response time for static assets when served from origin (e.g., JavaScript, CSS, and image files in themes and plugins).
P50, P75, and P95 are percentile metrics for comparing the amount of time that was required for some requests versus others made to the same environment to complete.
For example, P75 indicates that 75% of the requests on the environment had a response time lower than the P75 value, while the remaining 25% had a higher response time. This data represents the rate of change in the response times over time.
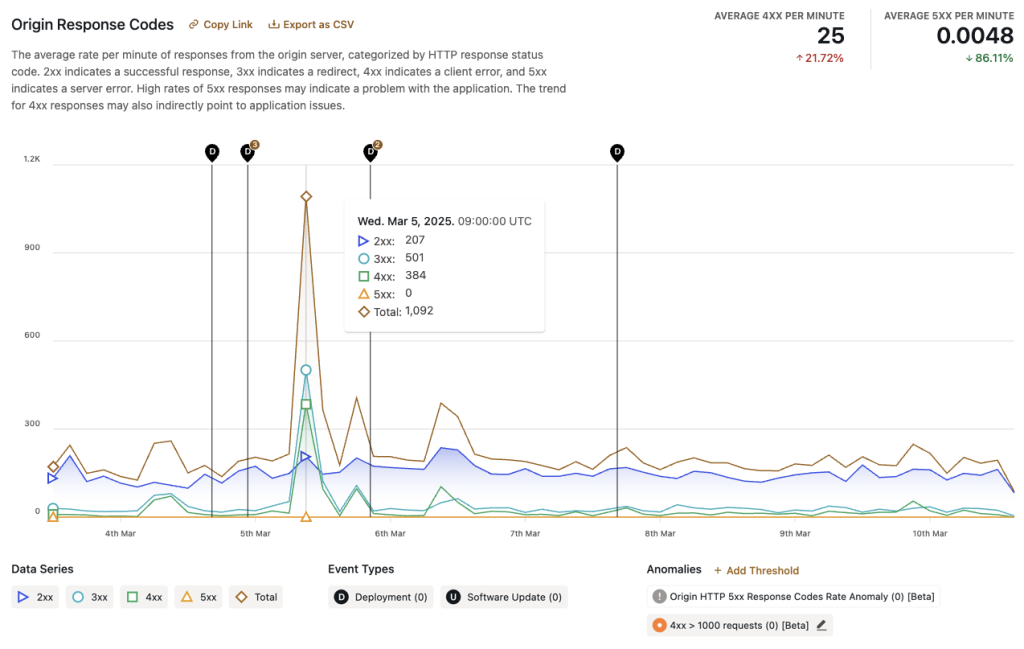
Origin Response Codes
Data in “Origin Response Codes” indicates the types of HTTP response status codes with which the origin server responds to an HTTP request, and the average rate at which they are returned.
Additional data highlighted in the upper right hand corner of the “Origin Response Codes” panel:
- Average 4xx per minute: The calculated average number of
4xxresponses returned per minute by origin within the currently displayed range of time. Below the average number of4xxresponses, the percent by which these responses have increased or decreased is also displayed. - Average 5xx per minute: The calculated average number of
5xxresponses returned per minute by origin within the currently displayed range of time. Below the average number of5xxresponses, the percent by which these responses have increased or decreased is also displayed.
A significant increase in the number of an application’s 5xx responses are indicated by the 5xx Response Codes Rate Anomaly Event Type in the “Origin Response Codes” panel.
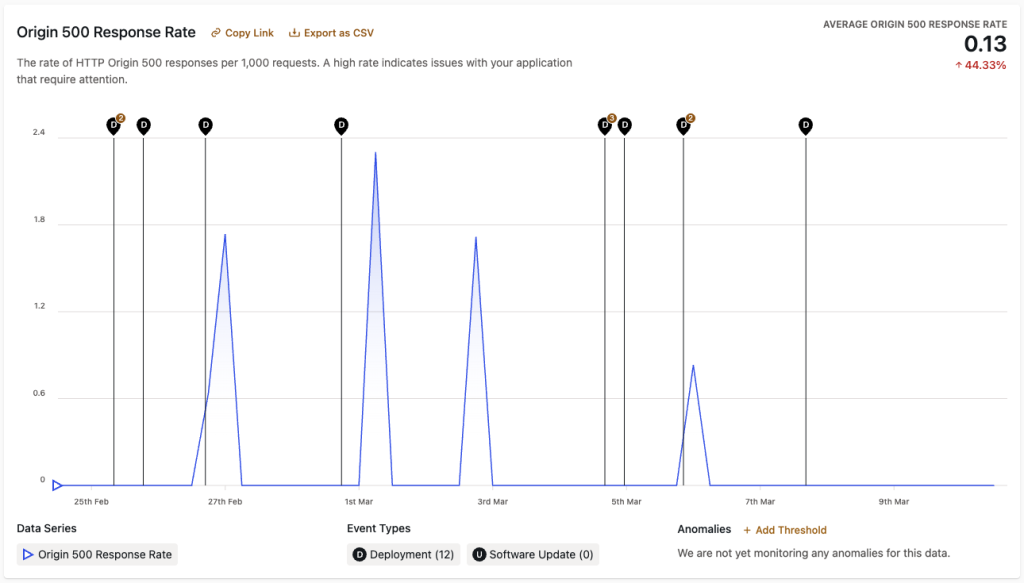
Origin 500 Response Rate
Data in “Origin 500 Response Rate” indicates the rate of 500 responses from origin per 1,000 requests at the application level. High rates of 500 responses indicate potential application issues that may impact functionality and should be investigated and addressed as soon as possible.
In addition to the displayed chart, the calculated Average Origin 500 Response Rate per 1,000 requests is displayed in the upper right hand corner of the panel. Below the calculated average, the percent by which these average responses have increased or decreased is also displayed.
Edge Response Codes
Data in “Edge Response Codes” indicates the types of HTTP response status code with which an edge cache CDN responds to an HTTP request, and the rate at which they are returned.
A sudden and significant increase in the number of an application’s HTTP responses with 429 Too Many Requests response status codes are indicated by the Edge 429 Response Codes Rate Anomaly Event Type in the “Edge Response Codes” panel.

Last updated: February 05, 2026