Database metrics
Insights into the size and health of an environment’s database can be reviewed in the Insights & Metrics panel, located in the application view of the VIP Dashboard.
Select the tab labeled “Database” to access metrics that indicate the efficiency of the queries made by application code to an environment’s database.
Database metrics are only displayed for WordPress applications and for qualifying Node.js applications.
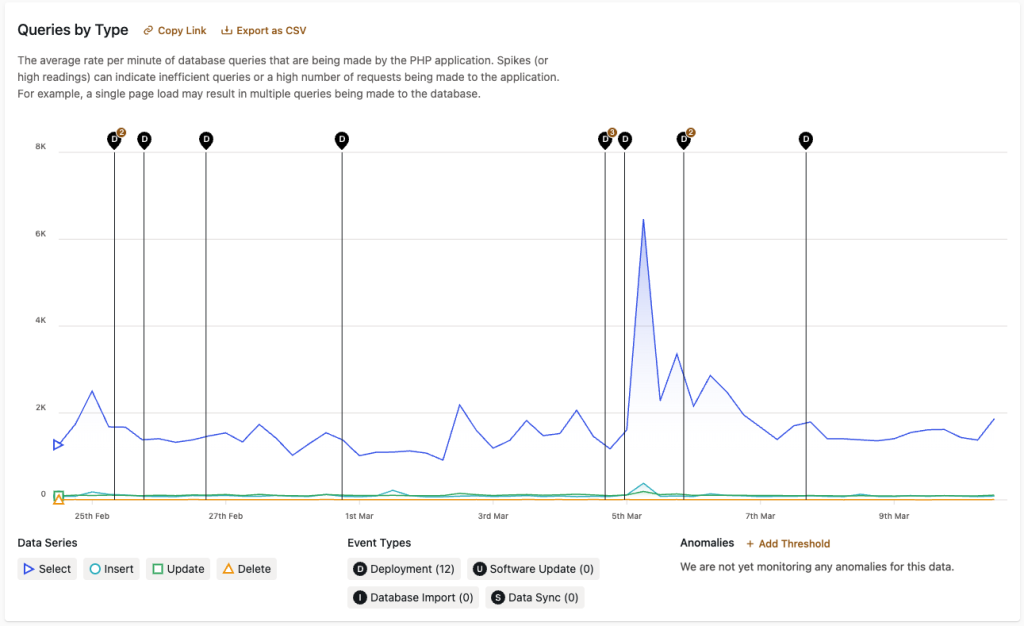
Queries by Type
The data in “Queries by Type” represents the rate of change in the number of database queries that are made by the PHP application. High query counts can indicate inefficient queries or a high number of requests being made to the application.
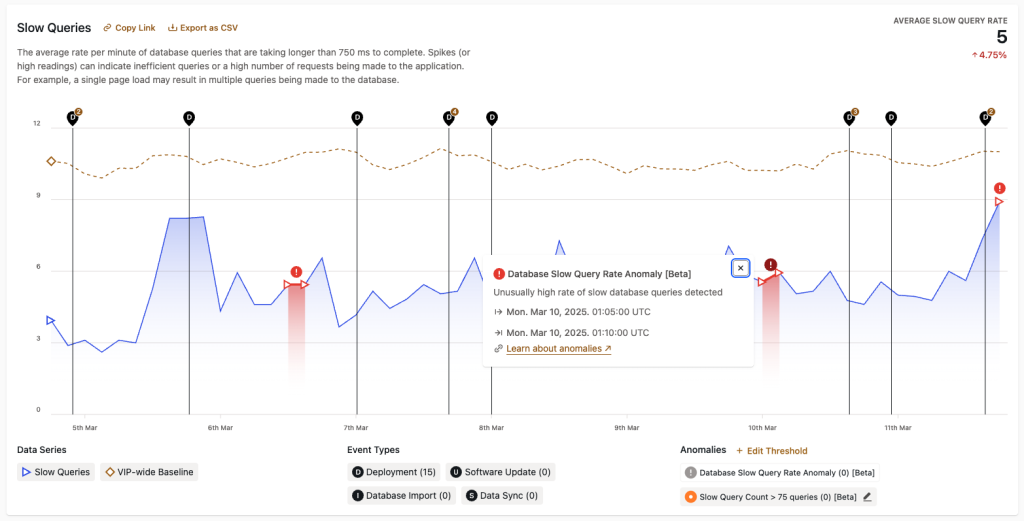
Slow Queries
The data in “Slow Queries” represents the rate of change in the number of database queries that require more than 750 ms to complete. Spikes (or high readings) can indicate inefficient queries or a high number of requests being made to the application.
Underlying causes for slow queries might not be immediately apparent, and more in-depth debugging may be needed. To investigate a slow query:
- Refer to the Slow Query Logs panel in the VIP Dashboard to review the most recent slow queries that have occurred on an environment.
- Stack traces for the provided Request URL value of a slow query can be reviewed by viewing the URL in a browser window with Query Monitor enabled. The Queries panel available in Query Monitor can provide detailed information about the Query, Caller, and Time elapsed for execution for each SQL query sent to the database by the current page.
An unusually large volume of SQL queries made by an application that take an unusually long time to execute are indicated by the Slow Queries Count Anomaly Event Type in the “Slow Queries” panel.
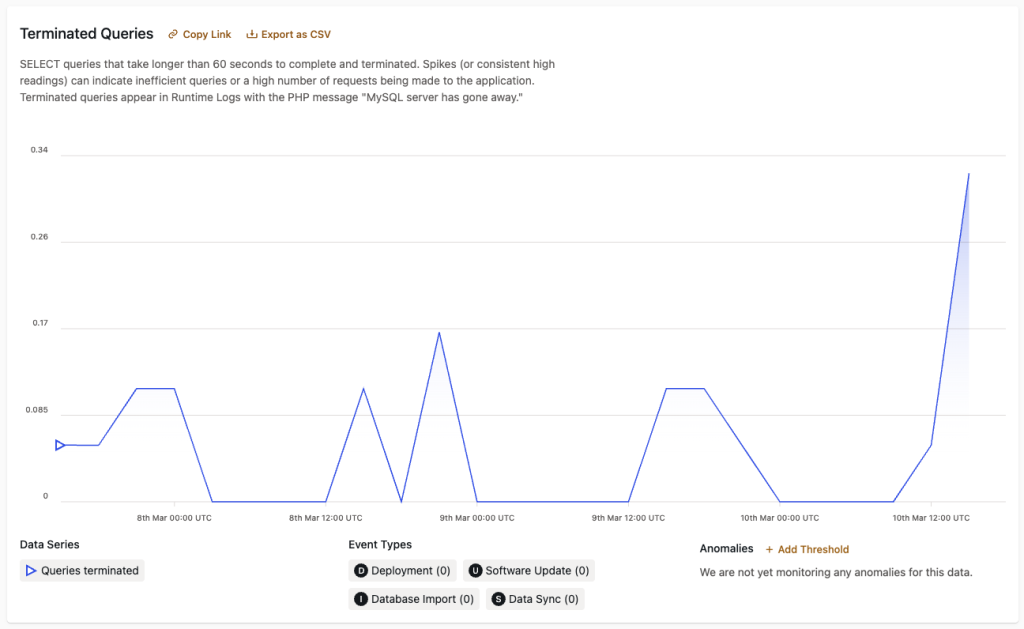
Terminated Queries
The data in “Terminated Queries” represents the quantity of SELECT queries within the currently displayed range of time that took longer than 60 seconds to complete and were terminated as a result. Only historical data no older than 1 July 2024 can be retrieved for terminated queries.
Data that represents spikes—or consistently large quantities—of terminated queries can indicate inefficient queries made by application code or a high number of incoming requests. A terminated query will also appear in a Runtime Logs entry with the PHP message MySQL server has gone away.
Inefficient database queries should be optimized to improve a site’s performance and resiliency.
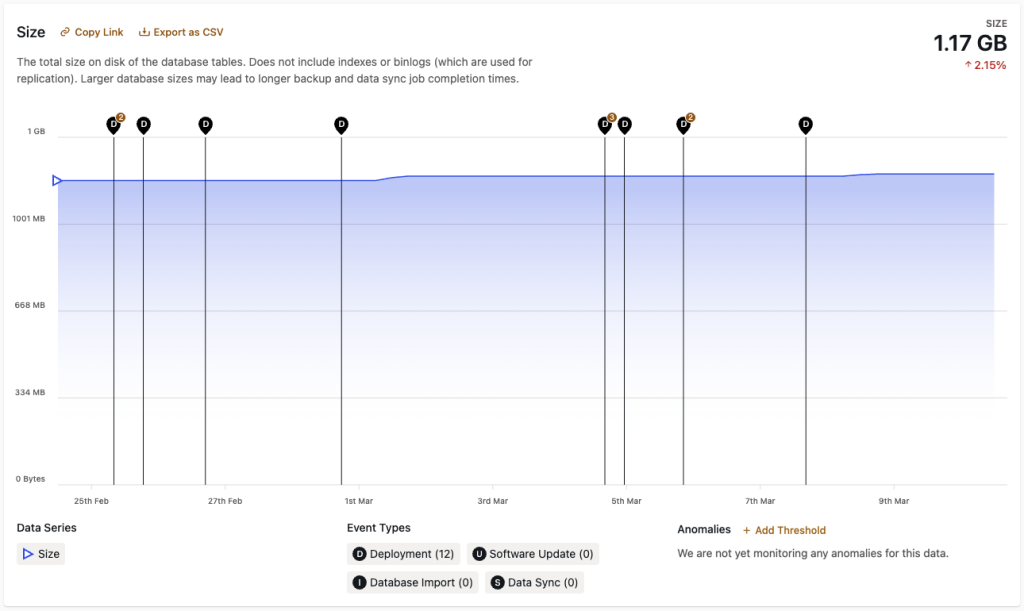
Size
Data displayed in this panel represents the total size on disk of an environment’s database tables throughout the currently displayed range of time. The values do not include Elasticsearch indexes or binlogs (which are used for replication).
The current size of the database is displayed in the upper right hand corner of the “Size” panel, and beneath it is the percent by which the size has increased or decreased within the currently displayed range of time.
Large databases
The current value for “Size” will not display for databases that are extremely large.
Larger database sizes can cause database sync and database backup processes to require a longer amount of time to complete.
Last updated: May 12, 2026