VIP Application Performance Monitoring
Note: This is an Open Beta
During open beta, VIP APM is available for production and non-production WordPress environments. The default sampling rate is 10%. Sampled data appears in a separate diagnostic interface opened from the VIP Dashboard.
VIP Application Performance Monitoring (VIP APM) monitors PHP code performance for WordPress environments on the VIP Platform. It provides sampled request, scheduled job, and command-line activity to help identify slow code, errors, database work, cache activity, WordPress hooks, and outbound HTTP requests.
Prerequisites
To enable or disable VIP APM, a user must have an Org admin role or an App admin role for the application.
If New Relic is active on the environment, review the switch behavior before enabling VIP APM. Enabling VIP APM automatically disables New Relic on that environment.
Limitations during open beta
- VIP APM supports production and non-production WordPress environments.
- The default sampling rate is 10%. Customers cannot change it.
- If New Relic is already enabled, enabling VIP APM will disable New Relic.
- Data sampled while VIP APM is active cannot be backfilled into New Relic.
- Browser monitoring and synthetic monitoring are not included in VIP APM.
- Node.js environments and environments on WP Cloud are not supported during open beta.
Enabling VIP APM
- Log in to the VIP Dashboard.
- Open the application view for the application.
- Select a supported environment.
- Select Performance from the application navigation.
- Select VIP APM.
- Select Enable.
- Review the confirmation dialog. If New Relic is active, the dialog explains that it will be disabled and that VIP APM data cannot be backfilled into New Relic.
- Select Enable VIP APM.
- Confirm that the service status changes to Enabled.
VIP APM uses a default sampling rate of 10% during open beta. Summary counts, charts, and traces represent sampled activity rather than all activity on the environment.
Opening the diagnostic interface
- Open Performance and VIP APM for the environment.
- Confirm that the service status is Enabled.
- Select View in VIP APM.
The diagnostic interface opens in a new browser tab. The access link expires shortly and can only be used once. If the link expires, return to the VIP Dashboard and select View Environment in VIP APM again.

The Trace Explorer provides filters, performance charts, summary metrics, and sampled traces for the selected environment.
Forcing a specific request to be traced
VIP APM samples 10% of application activity during open beta. To force a specific request into the sample, append apm-force-trace=1 to any URI that reaches the application origin.
For a URI without existing query parameters:
https://example.com/path-to-test/?apm-force-trace=1
For a URI that already has query parameters:
https://example.com/path-to-test/?existing=value&apm-force-trace=1
The parameter forces only that origin request to be traced. It does not change the environment sampling rate.
After loading the URI, open VIP APM and select a time range that covers the request. Find the matching time and path in the trace table. If the response includes an X-Tirad-Trace header, its value is the trace ID.
Investigating application performance
- Select a preset time range or define a custom range.
- Review the summary for request activity, error rate, peak p95 latency, and the latest p99 latency.
- Review the Transaction time, Throughput, and Latency charts.
- Select Errors to show failed activity only.
- Filter by an external host to find traces that include outbound HTTP requests.
- Set a minimum duration to focus on slower activity.
- Filter by a route, scheduled job, or command-line task.
- Select a row in the trace table to open its trace details.
- Use Flame or Waterfall to inspect the order and duration of spans.
- Select By type to group work by database, cache, HTTP, hook, job, and other activity.
- Select By owner to group work by WordPress core, plugin, theme, or must-use plugin ownership.
- Select Show slow spans to reduce the trace to its slowest work.
- Select a span to review its duration, status, service, and recorded attributes.
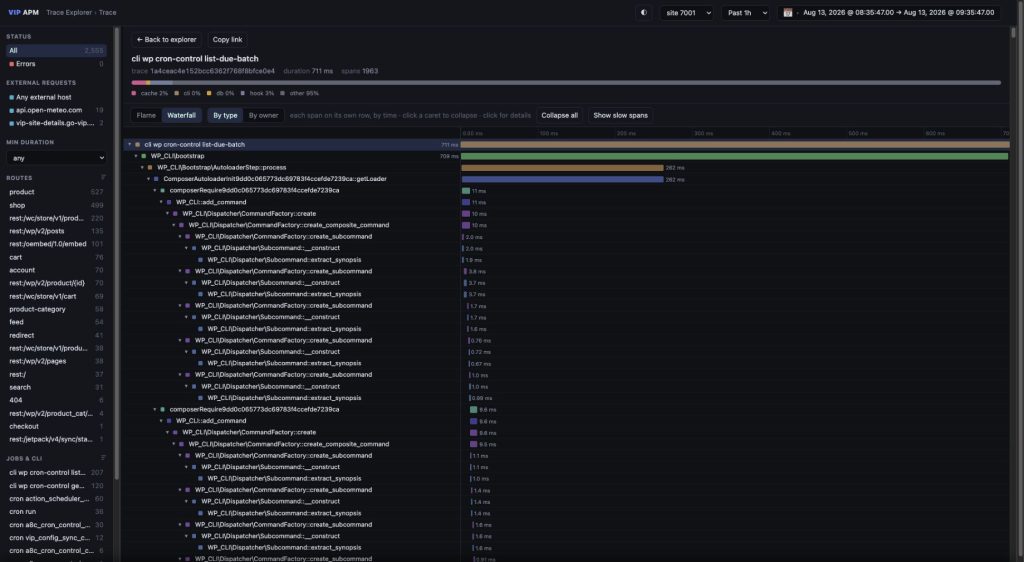
The Waterfall view positions each span by start time and duration. Select Flame to view the same trace by call hierarchy.
Use Insights & Metrics for a broader view of application health and usage. The resources for identifying performance issues describe other tools available on the VIP Platform.
Understanding the diagnostic views
| View | What it shows |
|---|---|
| Summary | Sampled activity, error rate, peak p95 latency, and the latest p99 latency for the selected range. |
| Transaction time | Average execution time grouped by work type or code owner. |
| Throughput | Sampled activity per second over the selected range. |
| Latency | p50, p95, and p99 execution time over the selected range. |
| Trace table | Individual requests, scheduled jobs, and command-line tasks with duration and status. |
| Flame | Nested execution spans grouped by call hierarchy. |
| Waterfall | Individual spans positioned by start time and duration. |
| Span details | Recorded attributes for the selected span, including available database, cache, process, and WordPress context. |
Disabling VIP APM
- Open Performance and VIP APM for the environment.
- Select Disable.
- Review the confirmation dialog.
- Confirm the change.
Disabling VIP APM stops new performance data from being sampled for the environment. Use the separate switch-back action when New Relic must be reactivated.
Providing feedback during open beta
Use the VIP APM Open Beta feedback form for product feedback after using VIP APM.
Use the VIP APM bug report form to report a specific problem.
Do not include passwords, personal data, query values, or full trace contents.
Troubleshooting
The VIP APM page is not available
Confirm that the selected environment is a WordPress environment. Production and non-production environments are supported. Node.js environments are not supported during open beta.
The enable action is not available
Confirm that the user has an Org admin or App admin role for the application.
The diagnostic link has expired
Return to the VIP Dashboard, open Performance and VIP APM, then select View Environment in VIP APM again.
The activity count is lower than the environment traffic
VIP APM uses a default sampling rate of 10% during open beta. Customers cannot change the sampling rate.
New Relic has a data gap
New Relic is disabled while VIP APM is active. Data recorded by VIP APM cannot be backfilled into New Relic after switching back.
Last updated: August 20, 2026