User-Defined Thresholds for anomalies
Performance metrics anomalies in an application’s Insights & Metrics panel are measured against the known range of metrics for a performant application. Users can define additional custom metric thresholds for performance anomalies based on their own criteria.
Notifications for anomaly events related to the custom thresholds can be optionally configured to be sent to a specific Destination to alert when the threshold is crossed.
Prerequisites
- To view existing User-Defined Thresholds in the Insights & Metrics panel, a user must have at minimum an Org member role or an App read role for that application.
- User-Defined Thresholds are only available for applications with an Enhanced, Signature, or Premier package.
Limitations
- The performance data charts and tables provided in the Insights & Metrics panel each track their own types of data. The set of data types for a specific chart or table is displayed in the area labeled “Data Series“. Only one User-Defined Threshold can be configured per-data type for a chart or a table.
- Only data for one User-Defined Threshold can be displayed in a chart or a table at one time.
- Only production environments can have User-Defined Thresholds.
Add or edit a User-Defined Threshold
Prerequisite
To add, edit, or remove User-Defined Thresholds in the Insights & Metrics panel—and to configure a Notification—a user must have at minimum an Org member role or an App write role for that application.
In the Insights & Metrics panel of the VIP Dashboard for a specific application environment:
- Locate the performance data chart (e.g., “Origin Response Time“, “Object Cache Hit Rate“, “Slow Queries“) to which the User-Defined Threshold will be added.
- Locate the button labeled “+Add Threshold” or “+Edit Threshold” at the bottom right of the chart. The title is dependent on the types of data that are listed in the current data chart’s Data Series and whether a User-Defined Threshold already exists within that series.

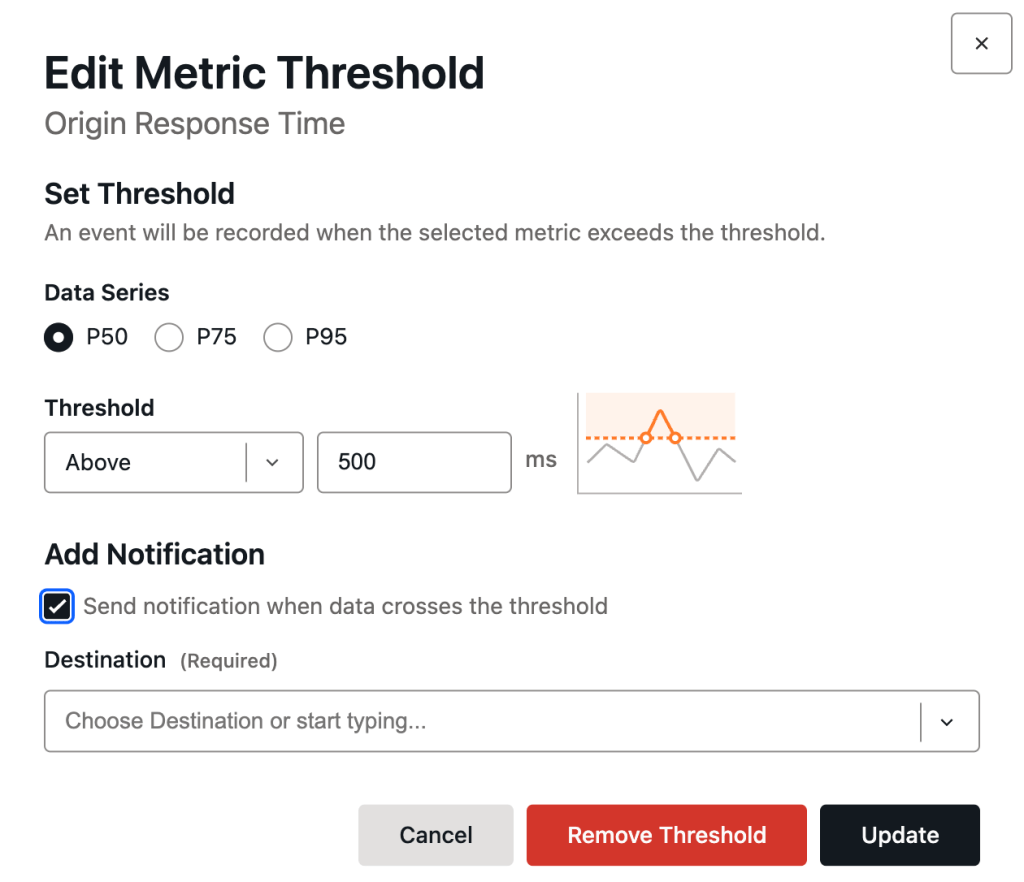
- Add or edit a metric threshold in the dialog titled “Add Metric Threshold” or “Edit Metric Threshold“. Configure the available setting options:
- In the section labeled “Data Series“, select the radio button for a data type.
- In the section labeled “Threshold“, select either “Above” or “Below” from the dropdown menu to specify the direction of monitoring for a metric in relation to the threshold.
- In the section labeled “Threshold“, add an integer value to the input field. Or, select the “up” or “down” arrows to increase or decrease the integer value in the input field.
- Optionally enable a Notification for the new or edited User-Defined Threshold.
- Select the checkbox labeled “Send notification when data crosses the threshold“.
- Select the dropdown labeled “Destination” and choose a Destination for the Notification from the dropdown list. Only an existing Destination can be assigned to the Notification. A new Destination cannot be created from within the dialog.
- Add, update, or remove a User-Defined Threshold:
- To add the new metric threshold, select the button labeled “Add Threshold“.
- To save updates made to an existing metric threshold, select the button labeled “Update“.
- To remove an existing metric threshold, select the button labeled “Remove Threshold“.
Last updated: July 31, 2025