Traffic Classification metrics
Insights into the types of traffic an environment receives can found in the Insights & Metrics panel, located in the application view of the VIP Dashboard.
Select the tab labeled “Traffic Classification” to view requests to a WordPress or Node.js application, grouped by likely traffic type.
Traffic Classification metrics help identify changes in request patterns, such as an increase in crawler or AI agent activity. This is useful context when investigating performance, cache behavior, or unexpected changes in traffic volume.
Traffic categories
Requests are grouped into the following categories:
- People: Requests classified as traffic from humans. This is typically browser activity from visitors, but can also include bots or AI agents that mask their identities to appear human.
- AI Agents: Requests identified as traffic from AI agents, assistants, or AI-related automated systems.
- Crawlers: Requests identified as automated crawler traffic, such as search engine crawlers, site monitors, scanners, software libraries, fetchers, or similar automated clients.
- Unidentified: Requests that could not be reliably classified.
Summary metrics
The summary cards display the total number of requests for the selected time period, along with the percentage of traffic classified as People, AI Agents, and Crawlers.
Each card can also show how the current value compares to the previous period.

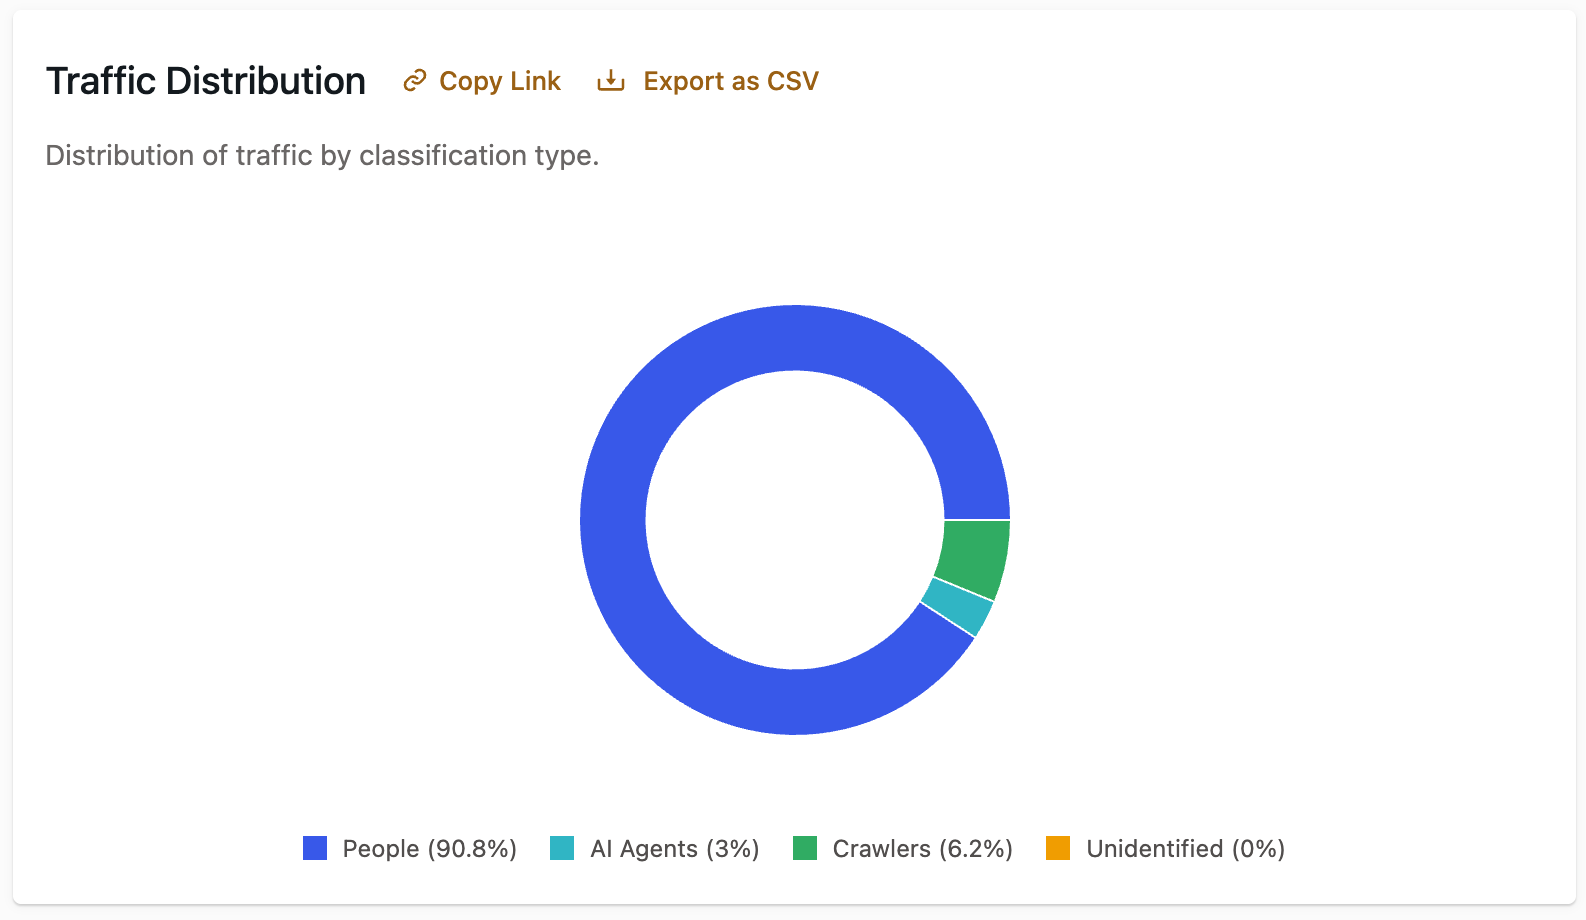
Traffic Distribution
The “Traffic Distribution” panel shows the percentage of requests in each traffic category for the selected time period. Use this view to understand the overall composition of traffic reaching the environment.
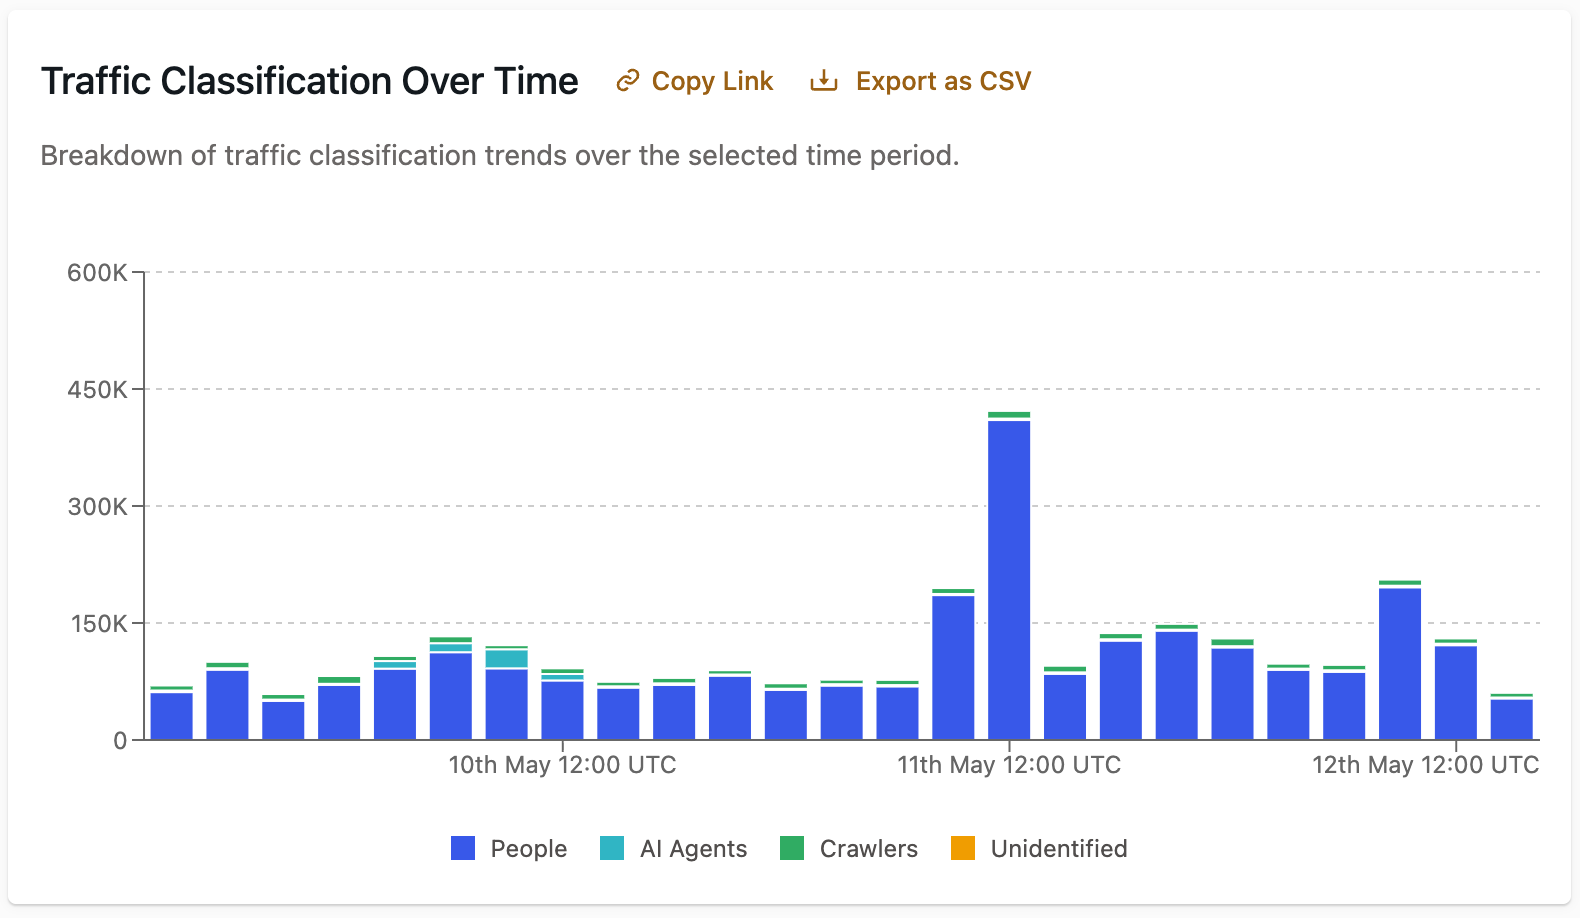
Traffic Classification Over Time
The “Traffic Classification Over Time” panel displays a stacked bar chart showing how traffic categories changed across the selected time period.
Use this chart to identify spikes, drops, or gradual changes in a specific category, such as an increase in crawler or AI agent traffic.
Traffic Classification Details
The “Traffic Classification Details” table provides a detailed breakdown by traffic class, including request counts, percentages, and trend indicators.
Some classes include subclasses that provide more detail about the type of traffic. For example, traffic classified as AI Agents might include subclasses such as AI Data Scraper or AI Search Crawler. Traffic classified as Crawlers might include subclasses such as Software Library or Fetcher.

Traffic Operator Details
The “Traffic Classification Details” table can be switched from Class to Operator.
The “Traffic Operator Details” view displays traffic by detected operator or bot name when that information is available. If an operator cannot be identified, it appears as Unknown. This can help identify specific automated sources contributing to a traffic category.

Last updated: May 12, 2026