Performance metrics anomalies
Performance metrics anomalies are events that indicate a degradation in performance related to a production environment’s object cache hit rate, slow queries, number of 5xx responses from the origin server, or the rate of 429 responses from the edge server—as measured against the known range of metrics for a performant application.
Performance metrics anomalies are one of several significant types of events (e.g., detected anomaly, code deployment, software update) that can occur on an environment. The occurrence of any of those events on an environment are indicated by Event Types markers in the Insights & Metrics panel.
The appearance of the Anomaly Event Type differs depending on the currently selected display format for the data.
- In chart format, Anomaly Event Types are represented by a capital “A” within a red circle. Select the Event Type marker to access more information about the event.
- In table format, linked text descriptions of Anomaly Event Types are located in the column labeled “Events”. Select the linked text to access more information about the event.
Automated Notifications can also be configured to communicate Anomaly Event Types when they occur on an environment.
Access
Prerequisites
- Anomaly Event Types are only provided for applications with an Enhanced, Signature, or Premier package.
- Anomaly Event Types are only available for production environments.
- To access the Insights & Metrics panel, a user must have at minimum an Org member role or an App read role for that application.
Anomaly Event Types are indicated in specific sections of the Insights & Metrics panel.
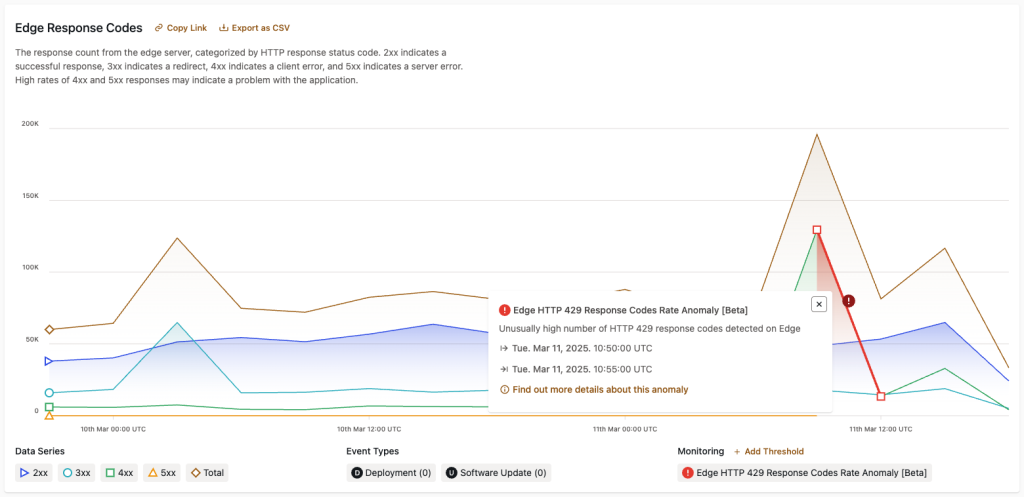
- Edge 429 Response Codes Rate anomalies are indicated in the “Edge Response Codes” section, located in the tab labeled “HTTP“.
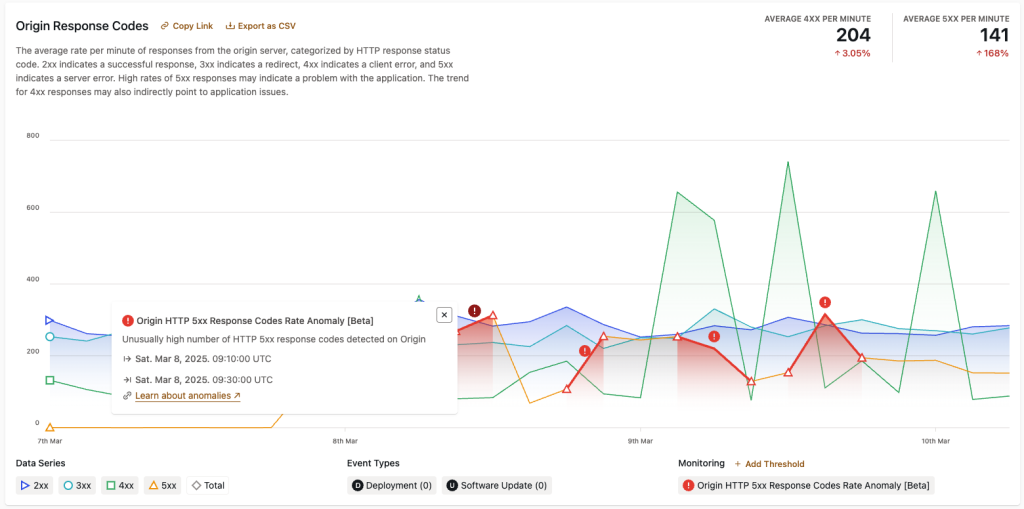
- 5xx Response Codes Rate anomalies are indicated in the “Origin Response Codes” section, located in the tab labeled “HTTP“.
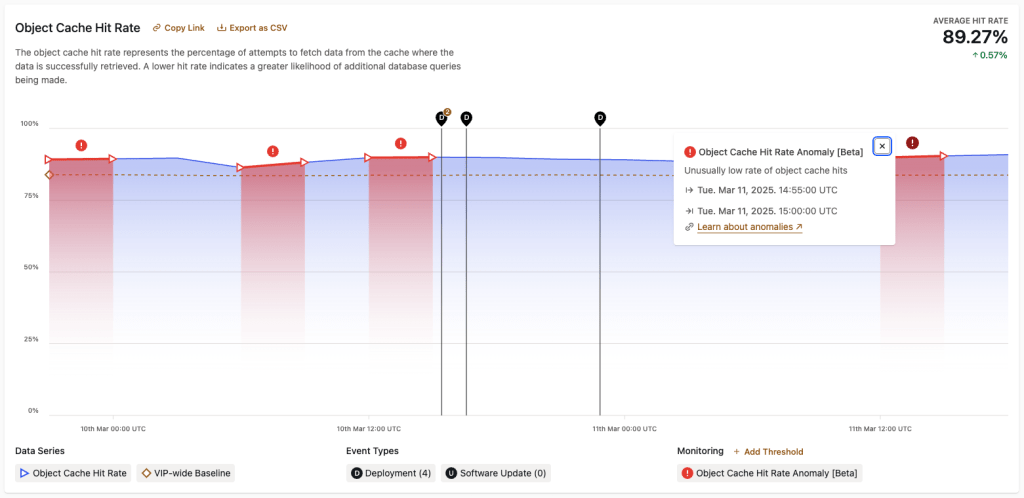
- Object Cache Hit Rate anomalies are indicated in the “Object Cache Hit Rate” section, located in the tab labeled “Cache“.
- Slow Queries Count anomalies are indicated in the “Slow Queries” section, located in the tab labeled “Database“.
Edge 429 Response Codes Rate
The Edge 429 Response Codes Rate Anomaly Event Type indicates a sudden and significant increase in the number of an application’s HTTP responses with 429 Too Many Requests response status codes.
Several different types of events may cause a sudden increase in requests to a site. This could be a malicious attempt to compromise a site’s performance, an incorrectly configured reverse proxy, or even an overly aggressive bot scraping a site’s content. The WPVIP Platform has built-in brute-force protections that monitor for this type of behavior and dynamically applies restrictions to suspicious traffic patterns.
Though these safeguards are in place to mitigate the negative effects on an application’s performance and stability, it is strongly recommended to optimize an application’s server performance under normal conditions in order to improve its resilience when traffic spikes occur.
More Details for 429 Edge Response Code Anomalies
More details about 429 edge response code anomalies that have occurred in the last 5 days can be accessed by selecting the Anomaly Event Type marker. A dialog will appear displaying the range of time in which this anomaly was detected as well as a link to “Find out more details about this anomaly”. Selecting this link will bring up a second dialog box, showing further information about the event.
For single sites, this will include the total number of HTTP requests with 429 status code observed for the anomaly duration as well as the top 5 IP addresses and top 5 user agents attached to these requests. For multisite applications, this dialog includes the top network sites impacted by this event.

5xx Response Codes Rate
The 5xx Response Codes Rate Anomaly Event Type indicates a significant increase in the number of an application’s 500–599 HTTP response codes, also referred to as “5xx“. 5xx responses indicate a server error on a PHP (WordPress) or Node.js origin server. Server errors are a strong indication that the application—or the server it is running on—is in an unhealthy state and requires investigation and intervention. Server errors can also cause end users to experience service disruptions.
Consistently low numbers of 5xx responses on an application are not usually evidence of serious performance issues and will typically not be indicated as an anomaly. The 5xx Response Codes Rate Anomaly Event Type most often indicates large spikes in 5xx responses in a short amount of time, or a consistently increasing trend in 5xx responses.
5xx responses almost always generate a log entry in an environment’s Runtime Logs, retrievable in the VIP Dashboard or with VIP-CLI. In most cases, the timestamp of a recent 5xx Response Codes Rate Anomaly Event Type can be correlated with the timestamp of an entry in Runtime Logs. Runtime Logs do not persist for any specific length of time and are cleared due to a variety of events. For this reason, this method is most useful only for real-time reference.
For environments that have New Relic enabled, more historic analysis can be performed with New Relic’s Error Tracking.
For environments that have HTTP request Log Shipping enabled, application errors can be analyzed more deeply in the shipped request logs.
Object Cache Hit Rate
The Object Cache Hit Rate Anomaly Event Type indicates a drop in cache hit rate for the environment’s object cache.
A drop in cache hit rate often occurs after a code deployment that includes modifications to object cache logic. If there is evidence that a recent code deployment has caused significant negative effects on application performance, a rollback to the previous code deployment is recommended. A rollback to a previous deployment can be performed in the Deployments panel of the VIP Dashboard.
The effect of application code on the performance of its object cache can be investigated in Query Monitor. To diagnose a cache logic issue, load a site’s recently updated page with Query Monitor enabled. The “Object Cache” panel in Query Monitor displays a wide range of object cache statistics for a page including the amount of time the object cache took to retrieve all requested data and the total size of all objects stored in memory. Look for cache entries that are set and added, verifying the cache group and key for reference. Refresh the page and use the cache group and key for reference to check if any of those entries are being added again. Entries added on every page refresh indicate a cache logic issue.
If an Anomaly Event Type occurs in the “Object Cache Hit Rate” section within a range of time that does not immediately follow a code deployment, additional investigation will be needed to identify the cause for the event. If a particular URL has an intermittently slow issue due to object caches expiring, New Relic (if enabled) can capture a trace. Traces can be reviewed to determine where the most time is being spent.
Slow Queries Count
The Slow Queries Count Anomaly Event Type indicates an unusually large volume of SQL queries made by an application that take an unusually long time to execute. Identifying slow queries and optimizing their performance can improve database efficiency and the overall responsiveness of an application.
The underlying causes for a query’s poor performance might not be immediately apparent, and more in-depth debugging might be needed to improve the query’s performance.
To begin, the timestamp of a recent Anomaly Event Type occurring in the “Slow Queries” section of the Insights & Metrics panel can be correlated with the timestamp of a slow query listed in the Slow Query Logs panel of an environment’s VIP Dashboard. Only the 100 most recent slow SQL queries can be found in the Slow Query Logs panel, so not all occurrences of Anomaly Event Types will have a correlating log entry.
A Request URL value is provided for each slow query listed in the Slow Query Logs panel. Stack traces for the Request URL value can be reviewed by loading the URL in a browser window with Query Monitor enabled. The Queries panel available in Query Monitor can provide detailed information about the Query, Caller, and Time elapsed for execution for each SQL query sent to the database by the current page.

Last updated: March 21, 2025