Resource Usage metrics
Insights into the quality of performance of an environment’s infrastructure-level resources can be reviewed in the Insights & Metrics panel, located in the application view of the VIP Dashboard.
Select the tab labeled “Resource Usage” to access the data related to an environment’s resource usage.
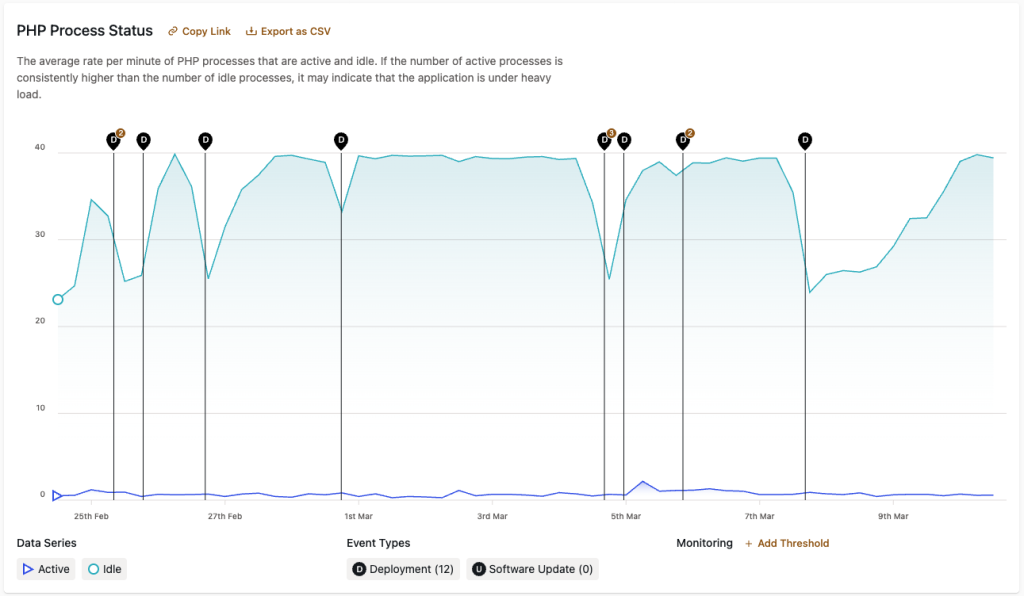
PHP Process Status
This section indicates the number of PHP processes on a WordPress environment that are currently active versus those that are idle. If the number of active processes is consistently higher than the number of idle processes, it may indicate that the application is under heavy load.

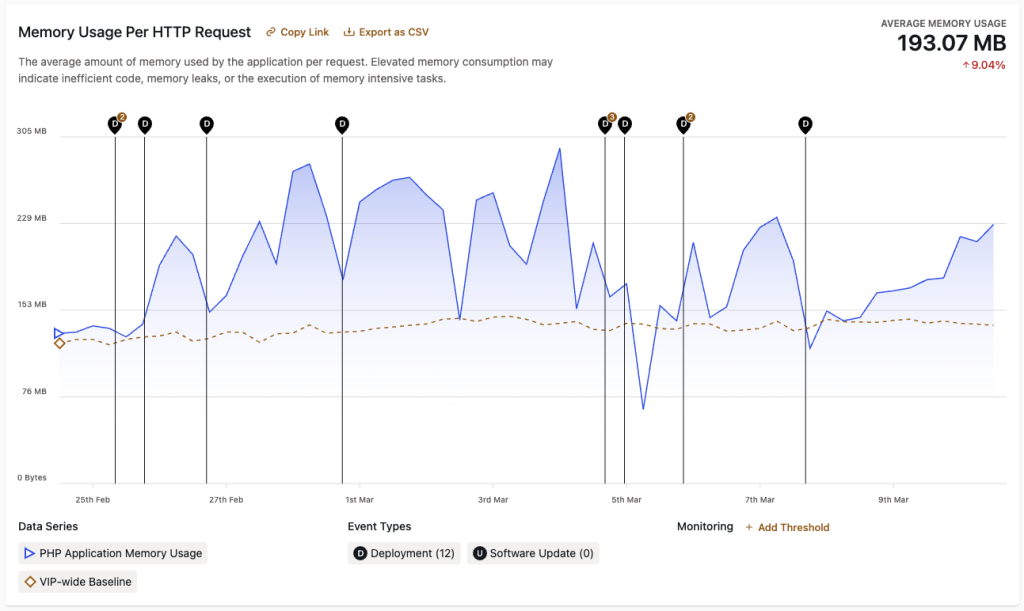
Memory Usage Per HTTP Request
The average amount of memory used by the application per request. Elevated memory consumption may indicate inefficient code, memory leaks, or the execution of memory intensive tasks. Some memory issues can be diagnosed while running application code on a VIP Local Development Environment. Xdebug can be useful for capturing memory usage profiles on a local environment.

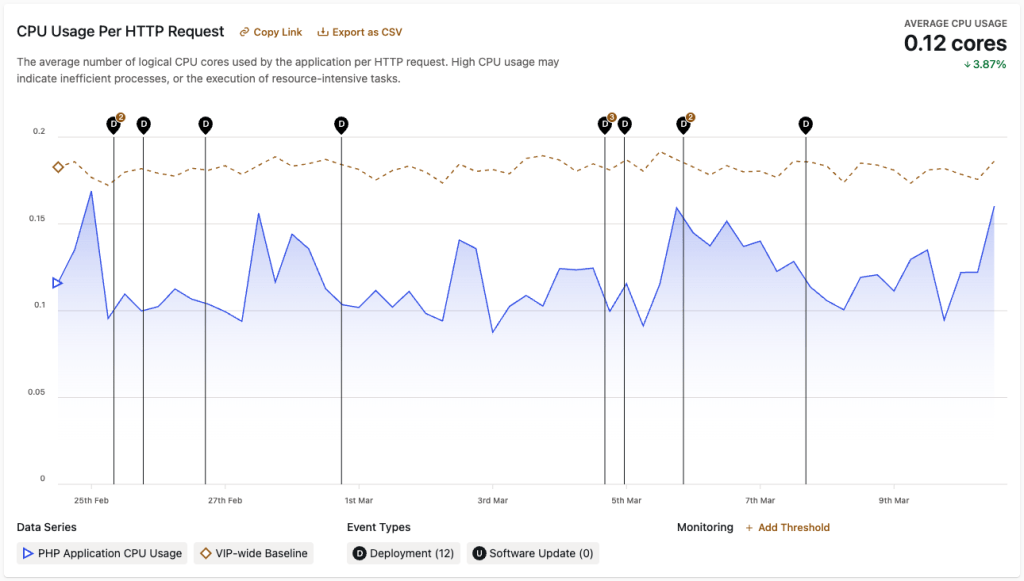
CPU Usage Per HTTP Request
Metrics in the “CPU Usage Per HTTP Request” section indicate the average number of logical CPU cores that are used by an application per HTTP request. High CPU usage can be caused by inefficient processes or the execution of resource-intensive tasks. For environments that have New Relic enabled, the efficiency of an application’s processes can be analyzed with transaction traces and distributed tracing.

Last updated: April 03, 2025