Query Monitor
Query Monitor is a WordPress plugin that provides a developer tools panel for debugging database queries, PHP errors, warnings and notices, hooks and actions, block editor blocks, enqueued scripts and stylesheets, HTTP API calls, and more. Query Monitor is loaded via VIP MU plugins on all VIP Platform WordPress environments. Users might need access to the plugin’s debug panels enabled through code or with VIP-CLI.
When active, a Query Monitor menu item will appear in the WordPress Admin toolbar and display a group of quick statistics that can be reviewed in greater detail in the Overview panel. Hover over the menu item to display a dropdown menu with available panels for the currently displayed page. The background color of the menu item will vary; for example, displaying red if there are errors on the page.

Select a panel in the dropdown menu to open the full Query Monitor panel at the bottom of the browser window. The menu displayed at the left of the Query Monitor panel will list the same panel options as the drop-down menu in the WordPress Admin toolbar.
Overview
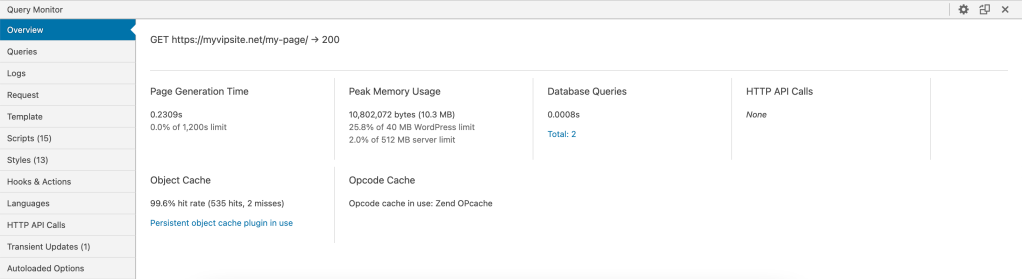
The Overview panel displays the URL and response code, Page Generation Time, Object Cache hit rate, Peak Memory Usage, the number of Database Queries, and the number of HTTP API Calls for the current page. High memory usage, many database queries and a high object cache miss rate can indicate issues impacting performance.
PHP Errors
The PHP Errors panel will only appear if code that executed during the loading of the current page caused a PHP error. The panel will display PHP errors including warnings and notices. Each listed error will include the file, line location (e.g., wp-content/themes/myviptheme/functions.php:109), and the Component responsible for generating the error. A drop-down menu labeled “Level” allows displayed errors to be filtered by error level.
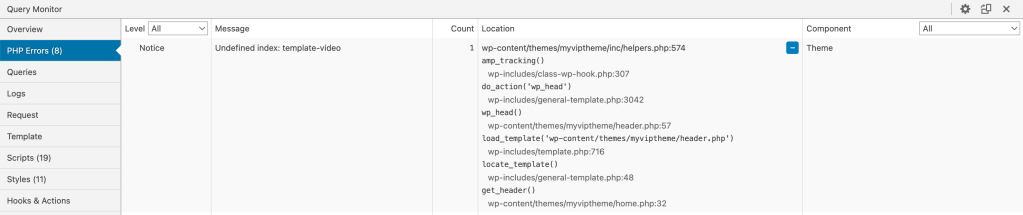
Select the blue + button beside the file and line location to expand and view the error’s stack trace.
Database Queries
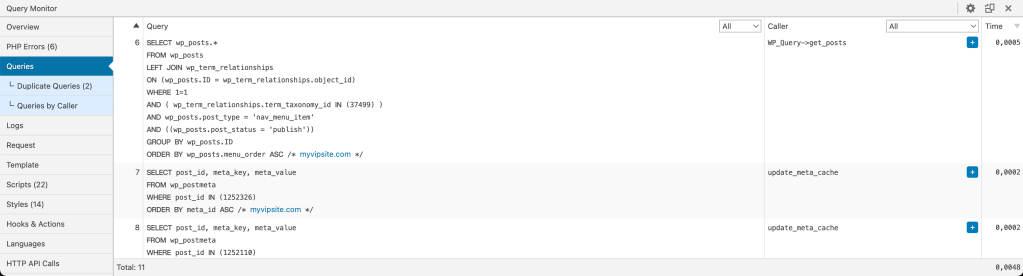
Detailed information about the Query, Caller, and Time elapsed for execution for each SQL query sent to the database by the current page.
- Select the dropdown menu located at the top of the Query and Caller columns to select a method for filtering the displayed information.
- Select the blue
+button displayed for each query in the Caller column to display a stack trace. - Sort the time column by toggling the arrow in the column heading.
SELECT queries are made to database replicas and should be used whenever possible. UPDATE queries are made to the primary database (“master”), which can negatively affect a site’s performance during high-traffic events.
Sub-panels providing additional information about queries:
- Duplicate Queries
- Queries by Caller
Object Cache
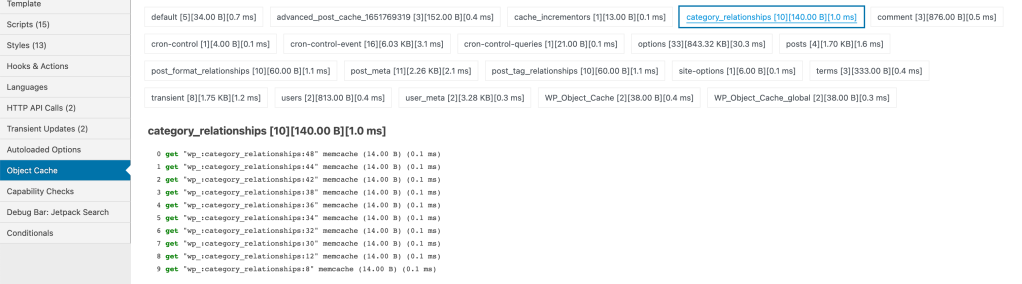
A breakdown of query time, size, number, and types of operations related to Object Cache (Memcache) that were performed on the current page.
At the top of the panel are object cache statistics for the page that is being displayed, including:
- Total Memcache Query Time: The time the object cache took to retrieve all requested data.
- Total Memcache Size: The total size of all objects stored in memory.
- Get: The number of
wp_cache_get()requests performed over the network and to the Memcache container. Individual instances ofwp_cache_get()tend to be quick, but because additionalwp_cache_get()requests are performed sequentially, the duration of time required to complete all of the requests can add up quickly and increase page request time. - Get_Local: The number of
wp_cache_get()requests that are retrieved from the process memory. These bypass the need for network round trips to the cache container. - Get_Multi: The number of times
wp_cache_get_multi()retrieved multiple data entries from a cache group. - Set: The number of times
wp_cache_set()was called to save data to object cache. This action requires a network trip to the Memcache container. - Set_Local: The number of times
wp_cache_set()was called and saved data to process memory and did not require a network trip to the Memcache container. - Add: The number of times
wp_cache_add()was called. - Delete: The number of time
wp_cache_delete()was called and deleted data from the object cache with a network trip to the cache container. - Delete_Local: The number of times
wp_cache_delete()was called and deleted data from process memory which did not require a network trip to the cache container. - Slow-Ops: The number of object cache operations that took longer than 5ms to complete.
- Get_Flush_Number: The stored value used for invalidating cache entries pre-appended with a flush number (along with a salt and other prefixes). When the cache is flushed, the flush number changes. This allows entries with the old flush number to be evicted.
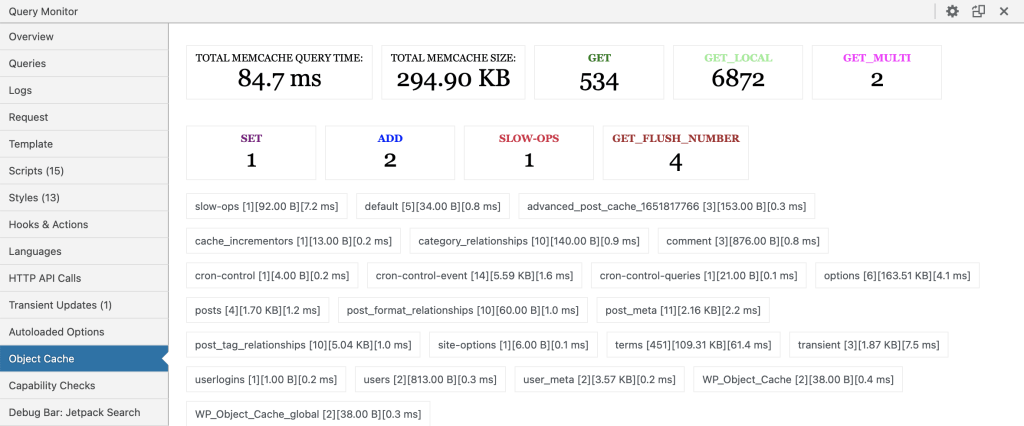
Selecting an object group will provide additional information about the contents of the object, its size, and request time.
Logs
Messages and variables can be logged in Query Monitor, similar to the method for calling console.log in JavaScript to log data to the console.
Requests
Details of the request made by the current page are displayed, including the request, matched rule, matched query, query string, query vars and a list of all matching rewrite rules.
Sub-panels:
- Request Headers: Request headers and their values are listed in this panel.
- Response Headers: Response headers and their values are listed in this panel.
- Hooks in Use: A list of hooks with filters or actions used by the current page. Each hook’s name, priority, callback, and component making the call are included. Select the blue
+button in the callback column to display the file path and line number for the callback function location.
Template
The active theme, the template hierarchy, the template file(s), and CSS body classes in use by the current page.
- Sub-panel: Hooks in Use
Theme-related hooks in use are listed in this panel. The Hook, Priority, and Callback, along with the Component, are listed under each column heading. Clicking the blue+button beside the callback will expand the line to include the file and line location of the hook.
Scripts
A list of loaded JavaScript files for the current page. Each script’s position, handle, host, source, dependencies, dependents, and version are listed across each row. Select the dropdown menus located at the top of the Host, Dependencies, and Dependents columns to select a method for filtering the displayed information.
- Sub-panel: Hooks in Use
Script-related hooks are listed in the Hooks in Use sub-panel. Each hook lists the priority, callback and component are listed across each row. Select the blue+button beside the callback to display the file and line location of the hook.
Styles
A list of loaded CSS files for the currently page. Each file’s position, handle, host, source, dependencies, dependents, and version are listed across each row. Select the dropdown menus located at the top of the Host, Dependencies, and Dependents columns to select a method for filtering the displayed information.
- Sub-panel: Hooks in Use
Style-related hooks are listed in the Hooks in Use sub-panel. Each hook lists the priority, callback and component are listed across each row. Select the blue+button beside the callback to display the file and line location of the hook.
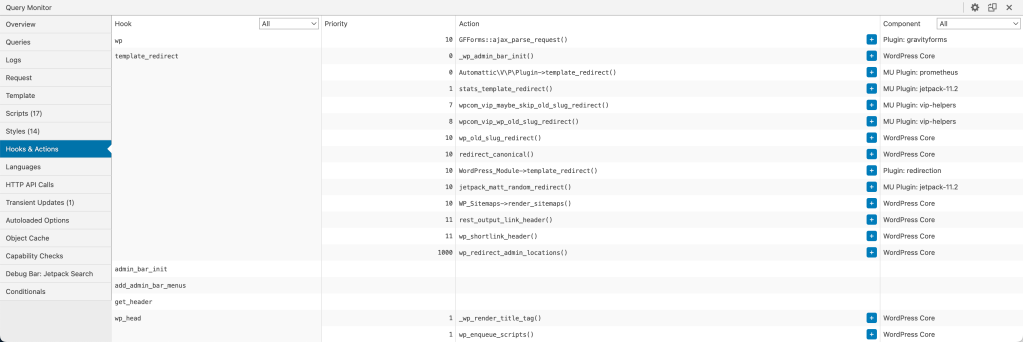
Hooks & Actions
All hooks and actions called by the current page are displayed in this panel. The priority, callback, and component for each hook are listed across each row. Select the blue + button to the right of items listed in the Action column to display the file and line location of the action. Select the dropdown menus located at the top of the Hook and Component columns to select a method for filtering the displayed information.
Languages
Translation (i.e., .mo) files are listed for multilingual websites, including any missing language files. The information displayed for each listed language file includes Text Domain, Type, Caller, Translation File, and Size. Select the blue + button beside the Caller to display the file and line location where the language files are loaded.
- Sub-panel: Hooks in Use
A list of language-related hooks, including each hook’s priority, callback, and components. Select the blue+button in the Caller column to display the file and line location of the hook.
HTTP API Calls
A list of Server-side HTTP API requests made during loading of the current page. Each HTTP API request includes the method, URL, Status, Caller, Component, Size, Timeout, and Time it took to complete the call.
Select the blue + button in the Status column to display the transport, DNS Resolution time, Connection Time, TTFB, Response Content-Type, and IP Address for each HTTP API request. Select the blue + button in the Caller column to display the stack trace. This panel can be sorted by Component. Select the dropdown menus located at the top of the Status and Component columns to select a method for filtering the displayed information.
- Sub-panel: Hooks in Use
Related hooks and actions for HTTP API Calls, including their priority, callback, and components. Select the blue+button in the Callback column to display the file and line location of the hook.
Transient Updates
A list of transients that were updated during loading the current page, including the transient name, type, expiration, size, caller and component. Select the blue + button beside the Caller to display the file and line location of the caller.
Autoloaded Options
Autoloaded options are listed in order of size from biggest to smallest. The total size of all autoloaded options of the current page is displayed at the top of the panel. Autoloaded options that reach 1 MB or larger can have negative performance implications.
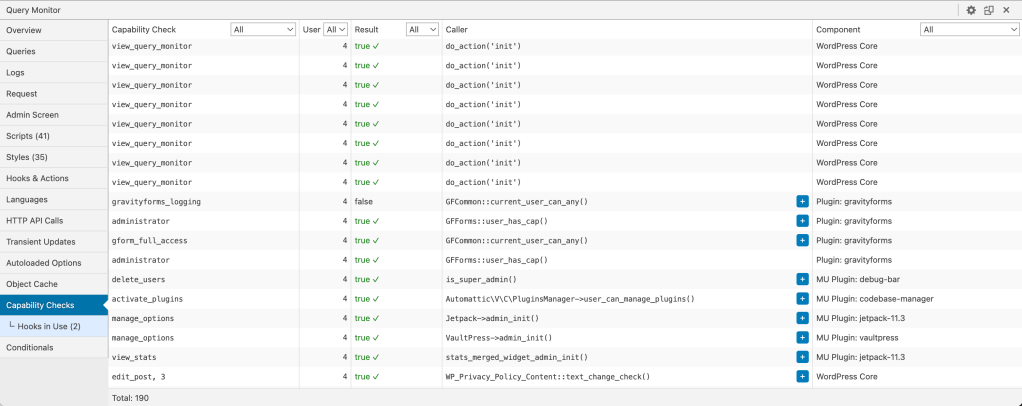
Capability Checks
Disabled by default. When enabled, the capabilities for the current user are displayed, including their Capability, User (id), Result, Caller, and Component for each check. Select the blue + button in the Caller column (if available) to display a stack trace.
- Sub-panel: Hooks in Use
The priority, callback, and component for each listed Capability-related hook is displayed across each row. Select the blue+button in the Callback column to display the file and line location of the hook.
Cron
Core and custom cron events and the information related to each are outlined in this panel. The top of the panel displays summary information including Total Events, number of Core Events, number of Custom Events, number of currently running cron events (Doing Cron), Next Event, and the Current Time in UTC.
Custom Events and Core Events are listed in separate sub-panels, and details for each event include Next Execution, Hook, Interval Hook, Interval, and Value Args.
Some listed cron events might have no actions hooked into them. This can occur if a plugin or a theme was de-activated or uninstalled and did not clean up after itself.
Conditionals
Conditional functions (e.g., is_front_page(), is_tag(), is_admin()) that the current page returns as true are listed in green under the True Conditionals heading. Conditional functions that the current page returns as false are listed in grey under the False Conditionals heading.
Last updated: August 08, 2024