Runtime Logs in the VIP Dashboard
Runtime Logs provides an aggregated, near real-time view into recent application logs generated by WordPress and Node.js environments on the WPVIP Platform.
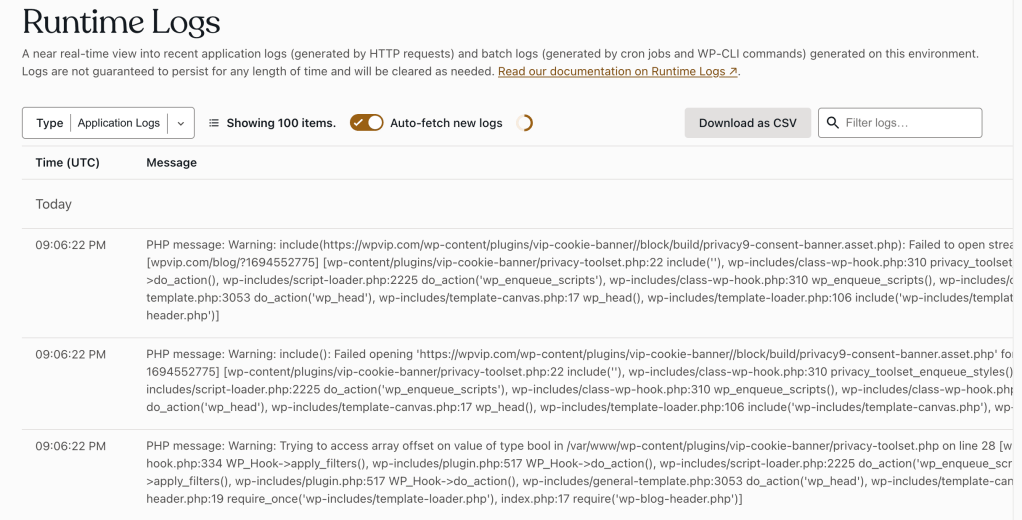
Review recently fetched Runtime Logs for an environment in the application view of the VIP Dashboard.
Runtime Logs can also be retrieved in the command line using VIP-CLI.
Review more details about Runtime Logs and existing limitations.
Access
Prerequisite
To access the Runtime Logs panel, a user must have at minimum an Org member role or an App write role for that application.
To access the Runtime Logs panel:
- Navigate to the VIP Dashboard for an application.
- Select “Logs” from the sidebar navigation at the left of the screen.
- Select “Runtime Logs” from the submenu.
The Runtime Logs panel is environment-specific (e.g., production, develop). A different environment can be selected from the dropdown located at the upper left of the VIP Dashboard application view.
Display setting options
A new set of Runtime Logs is fetched based on default settings when the “Runtime Logs” view of the Health panel is first loaded. Up to 100 log entries will be displayed at one time.
The view of the logs can be adjusted by updating available setting options.
- Select the Type of logs to view from the dropdown selector at the upper left hand corner of the panel.
- Application Logs are displayed by default for both WordPress and Node.js environments. Application Logs are from web containers (i.e. log entries generated by HTTP requests)
- Batch Logs are only available for WordPress environments. They from batch containers (i.e. log entries generated by cron tasks or WP-CLI commands)
- Auto-fetch new logs is enabled by default. When enabled, new logs are retrieved every 30 seconds and will be automatically appended to the list of logs displayed in the browser. Updated information reporting the number of appended logs and the time the last auto-fetch occurred is displayed below the list of logs.
Filter logs
The displayed logs can be filtered by searching for specific strings. Enter a value to filter by in the search field located in the upper right of the panel labeled “Search form“.
Export logs as a CSV
Export a copy of the displayed logs as a CSV file by selecting the button labeled “Download as CSV” located in the upper right of the panel.
A CSV file of the current logs displayed—based on any selected settings or filters—can be downloaded to the user’s local machine. Select the button labeled “Download as CSV” located in the upper right of the Health “Runtime Logs” panel.
Last updated: April 17, 2025